


For a long time, "random dialing" has been a great way to get a random sample that could include about 99% of the population (while the 1% without phones were generally considered to not need consideration for most purposes - everyone imagined jails and wilderness hermits in cabins). While incoming calls were free to telephone subscribers, and most of the population had phones, this was almost ideal. It wasn't actually sampling people, but households, since there was generally one phone per house. However, with this sampling frame it is possible to cleanly stratify by households size, and get back to estimating individuals fairly easily. At the beginning in the early 20th century, there was some problem with the number of households that had no telephone service, but as this shrank toward 1%, the error became negligible.
In the early 21st century, we now have a different problem: mobile phones often charge for incoming calls, so they are not allowed to be "random dialed", and more and more households are relying on them exclusively. How many? Well... I'll show you a picture.
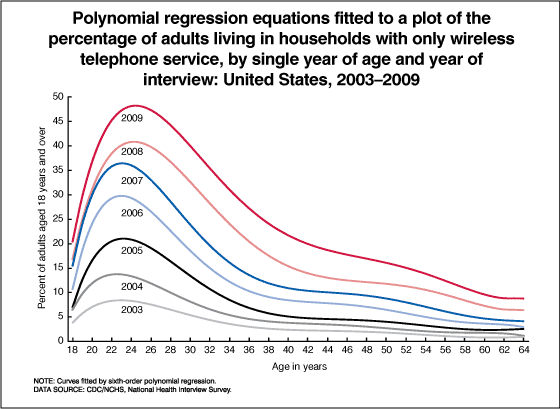
You can clearly see a fairly dramatic age bias. It appears that 25 year-olds are at about 50% reachability by "random dialing", while other age groups may be as high as 90% reachable. Les obviously, that 50% has a pretty good chance at being correlated with other aspects of their lives. Anything that can be done? Maybe. At the very least, stratify your sample by age and use data like that in the above chart to correct for reachability by age group.
If you have another sampling technique available, you can try to use it to infer differences within an age group between with-house-phone and without-house-phone, and then adjust your results appropriately for that. If it's at all controversial though, brace yourself. Even though you should now have more valid results, the people who agree with the groups that were originally overrepresented will now direct very pointed charges at you of "lying with statistics." Even though all you actually did was "question with statistics to the best of your ability."
There are many biases that will be harder to find. The most usual one: the survey
was planned by people who wanted to show "regular people" that is, the
people like themselves. And a sampling plan was drawn up that seemed like a good way to meet "random" people. Often the same way they meet random people - where they met the people they now hang out with - people they generally are similar to and
agree with. It's a very confirmatory feeling to have your survey agree with you, so people who have executed a survey this way may be a bit defensive if you suggest that it is perhaps just maybe a little tiny bit biased. Unfortunately, these surveys seem to be some of the most common ones in politics.
Sigh.
Update: The National Marine Fisheries Service is trialling a switch to postal surveys in light of the increasing problems with telephone surveys.
No comments:
Post a Comment